AlTi - Alvarium Tiedemann

Quarterly Market Update and Outlook | October 2023

By Nancy Curtin Published October 9, 2023

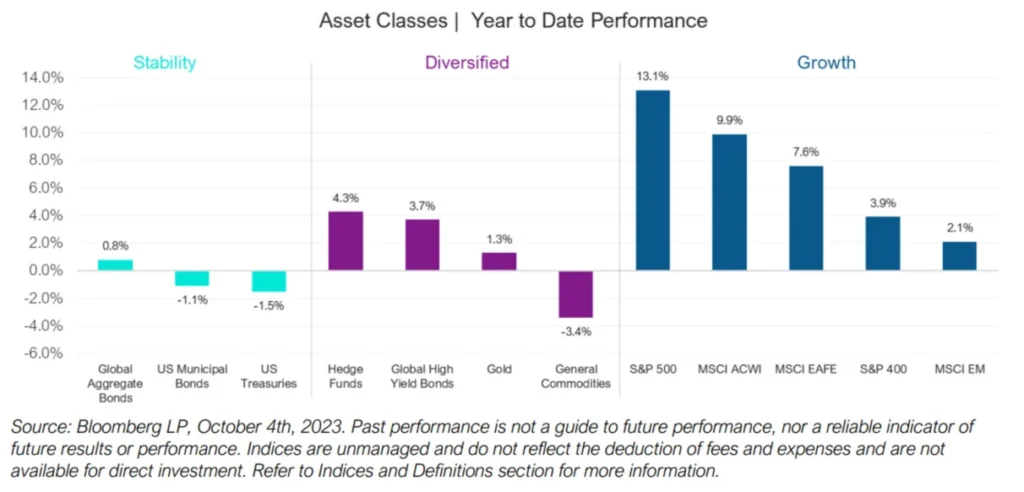
Markets: After a strong start to the year, stock and bond market returns have corrected.

Stability: Longer-dated government bond yields have risen, largely driving returns into negative territory.

Diversified: Hedge funds, high-yield bonds (credit) and gold remain important diversifiers and are still positive year to date. The rise in oil prices has led commodity returns to be less negative.

Growth: Stock markets have corrected from peak levels in July. Expectations of slowing GDP are weighing on growth assets, though markets (particularly US) still have positive YTD gains. Being diversified with exposure to growth, value and energy infrastructure has helped our portfolios mitigate some of the downturn.

The catalyst for a correction in markets has been a combination of factors:

  • Rising longer-dated government bond yields. The rise in US government bond yields by almost 1% since June is a significant tightening of financial conditions. The rise in yields is partly a function of investors demanding a higher return on government debt, given the size of the US fiscal deficit and concerns around increased Treasury issuance. Higher long-term yields raise the cost of capital for all borrowers and increase risks of instability in leveraged areas of the economy.

  • Rising oil prices. Recent increases in the price of oil by 30% serve as a tax on the consumer through higher retail gas prices. Persistent higher oil prices could impact inflation expectations, sparking a possible second wave of inflation. Notwithstanding the current tragic conflict in Israel, we think that oil prices will settle lower as Saudi removes their production cuts (expected by the end of this year) and as slowing global growth reduces demand.

  • Rising US dollar. The strong US dollar is a form of global tightening as assets move back to the US and import prices in international markets become more expensive. This comes at a time of vulnerability in Europe and China, which have already been slowing.

Markets will remain volatile as investors assess the impact of these risks on global growth and future earnings. However, tightening in financial conditions has a silver lining as this might be what is needed to quell inflation. In the words of Mary Daly, San Francisco Federal Reserve Bank president: “Recent tighter credit conditions could help the Fed by bringing inflation down, even without additional policy adjustments.”


Fundamentals: The US economy has remained resilient and now needs to slow. 

The tightening of financial conditions comes at a time when the US economy has remained surprisingly resilient. In contrast to Europe and China, the US experienced an acceleration of growth in the third quarter – perhaps a function of summer-seasonal travel or back-to-school spending. Consumption (which makes up ~70% of GDP) is forecasted to rise 4% in Q3, up from 0.8% in the second quarter. This comes despite 11 interest-rate hikes and the highest overall interest rates in 22 years.

Larry Summers calls the US an “Energizer Bunny Economy”, with job growth accelerating in the face of tighter credit conditions. Indeed, recent jobs data expanded by almost double what economists had expected. Core inflation and wage growth around the 4% mark continue to be too high for the Fed, although both measures are moving in the right direction.

There are several reasons that the US economy has remained so resilient.

  • Consumer confidence: US households accumulated excess savings during the pandemic that they are now spending on all forms of experiences, boosting the service economy. While these savings are dwindling (estimated around $200bn versus $2trn at the peak in 2022), overall household net worth has increased due to gains in property prices (now back to pre-pandemic levels), year to date gains from the US stock market and consumers’ ability to earn elevated returns on cash. The strong jobs market and wage gains have also contributed to consumer confidence.

  • Less interest-rate sensitivity: households and businesses locked in low borrowing costs so have been less sensitive to rising interest rates. For example, 75% of US mortgage holders carry 30-year fixed mortgages with rates below 4%. Large cap companies have seen net interest payments decline, even as the Fed has raised rates due to lower borrowing costs on debt refinanced in 2021. The refinancing of this debt is not a risk until 2026 at the earliest.

  • Stimulative fiscal policies: just as the Fed has been raising rates, the US government has supported growth with more than $1.5trn of multi-year fiscal programs. Companies have taken advantage of incentives and subsidies from these programs, with an estimated $200bn in projects commenced this year. Government spending has accelerated corporate investment spending. Investment rose at a rate of 7.4% in Q2 and is now at the highest level of GDP since the late 1980s. Continued investment spending improves productivity. Indeed, the US recorded its biggest increase in productivity in almost three years at 3.5% in Q2 from 1.2% in Q1.

  • Onshoring beginning to work: the US trade deficit also narrowed in August, its lowest level since September 2020, due to the continued weakness of imports as signs of onshoring take hold. This puts net trade on track to contribute to GDP growth in Q3.

In terms of GDP components, consumption (C), investment (I), government spending (G) and trade (X-M) in the US are all contributing to economic growth, despite the high interest rates. At the same time, C, I, and G are either negative or neutral in Europe and China. This dichotomy is what is causing US dollar strength.

Despite the tightening in market conditions, the Fed has made it clear that growth needs to slow to achieve its inflation goal of 2%. It will keep rates high and restrictive into at least mid-2024.

As Chair Powell recently noted: “Reducing inflation is likely to require a period of below-trend growth and some softening of labor market conditions.” 


Positioning: Market corrections are normal and can bring opportunity.

Markets typically correct once or twice each year, but the majority of the time even notable corrections still resulted in a positive overall yearly gain.

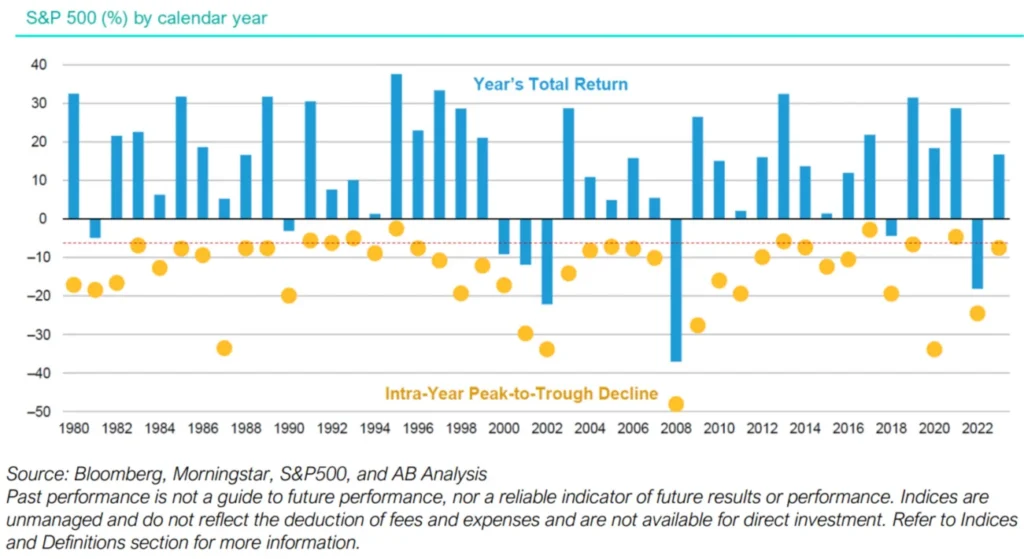
Historically, corrections are healthy. They reset valuations, remove froth in the markets, and provide opportunities. We can see such opportunities emerging from this corrective action in our Stability and Diversified exposures.

Stability:
The recent rise in longer-dated US Treasury yields provides an opportunity to lock in ~5% returns for 10 years. We have not seen this kind of seemingly relatively risk-free opportunity in decades. If we are right that the Fed can reduce inflation and ease next year, locking in such yields will avoid the reinvestment risk of holding shorter-term assets.
Exposure to long-dated US government bonds serves as portfolio ballast if growth disappoints more than expected. In this sense, longer-duration bonds provide a degree of recession protection, paying us for the added risk of a longer maturity.

Diversified:
As rates have risen, the return opportunity for credit has also risen. Part of the potentially outsized return available in credit today is a function of the higher cost of capital and part is a function of the turmoil in the banking sector. Banks are facing higher costs of funding for deposits and now need to shore up balance sheets in the face of increases in regulatory capital. This has caused them to retrench from riskier business, such as lending to private markets, leading alternative credit providers to fill the gap. Marquee credit platforms are generating low double-digit returns by lending to companies and other investors who need access to funding.
While lending into a slowdown brings risks, we focus on lending opportunities to profitable companies high up in the capital structure (senior secured, first lien) or asset backed with significant levels of collateral, as strong asset coverage and profitability can cushion risks in an economic slowdown. We are looking to combine this attractive absolute return opportunity with other diversified asset exposures positioned to provide downside protection.

Growth:
While equity markets may remain volatile, it is worth noting that higher Treasury yields do not mean stocks cannot perform. Inflation-adjusted yields averaged 3.5% between 1985 and 2005 (well above the current 2%) and yet the S&P 500 annualized at 15% per year.
We remain well diversified in terms of geography, sector, and style and are focused on quality assets. Quality companies with little or no leverage are in the best position to weather an economic slowdown. In June we added to quality mid-cap and value in the US, sectors that had underperformed in the early year rally and trade at multi-decade discounts relative to both their own history and large caps. Mid-caps have outperformed in most decades over the past century. 


Outlook to 2024: An improving picture.

Our base case is that inflation grinds lower as the US economy slows and that the Fed achieves that ever-elusive soft landing, defined as slowing growth without considerable damage to the economy and serious damage to the labor market. Soft landings are unusual and have happened just twice since 1970 (after the 1984 and 1994-95 tightening cycles) and might also have happened after the 2015-18 cycle in the absence of the pandemic.

What we know about soft landings:

  • Once the tightening cycle was over, the stock market accelerated quite rapidly.
  • Innovative technologies and enthusiasm around innovation growth and investment spend accelerated the advance.

Of course, steering the world’s largest economy into a soft landing as the rest of the world slows is not without significant risk. We, like the rest of investors, will be focused on economic and earnings data ahead to confirm or adjust our positioning.

One historical fact is also worth noting. We have never entered a recession in an election year in data going back to 1945. This may be partly due to the tendency of the Fed to raise rates in the pre-election year, so that high rates do not become a political issue.

In summary:

Diversification across asset classes is helping us weather the current volatility, while the rise in yields brings opportunities to our Stability and Diversified exposures. We think that public and private markets are poised to benefit once the tightening cycle has abated. Growth assets in quality companies with a significant valuation cushion and assets exposed to long-term secular trends such as in Generative AI and the climate transition should perform better as we move into 2024. See our recent pieces for further insight.

On a final note, our hearts and prayers are extended to those impacted by the terrible events in Israel.

While the human scale and tragedy is terrible, so far it has had limited impact on markets. US government bond prices and the US dollar have strengthened somewhat. Oil prices have risen to above $90. A broadening of the conflict would change the equation, however.

From a policy perspective, Hamas’s surprise attack may diminish the ability of President Biden to shape a deal that normalises relations between Saudi Arabia and Israel. A diplomatic solution is desperately needed, though as we write no clear end of the conflict is in sight.

A truly devastating series of events for hopes of greater peace in the region. 


Download the PDF version of our commentary below.

About the author
  • Nancy Curtin

    Nancy Curtin sits on AlTi’s Board of Directors and is our Global Chief Investment Officer. She is also a member of the firm's Executive Committee. She has held Global CIO, Head of Investments and senior C-suite leadership roles at multiple firms since 2002, including Fortune Asset Management, Close Brothers Asset Management and Alvarium Investments

More ideas

Notes & Important Disclosures

This information is being provided by AlTi Global Inc. (“AlTi”), exclusively for use by recipient. For the purposes of this disclosure, AlTi includes certain of AlTi’s affiliates that are registered as investment advisers with the U.S. Securities and Exchange Commission, (each, an “AlTi Affiliate RIA” and collectively, “AlTi Affiliate RIAs”) that provide investment advisory services. Any investment products referred to herein are managed and / or advised by one or more of AlTi Affiliate RIAs. No part of this material may, without AlTi’s prior written consent, be copied, photocopied, or duplicated in any form, by any means. AlTi is providing this information solely in connection with providing general investment advisory services and is not in connection offering investment advisory services with respect to any “private funds” that are managed by such AlTi Affiliate RIAs. The information provided is in no way intended to be considered a recommendation, or an offer to sell, or a solicitation of any offer to buy, an interest in any security, by AlTi or any AlTi Affiliate RIA, including an interest in any investment vehicle or any other financial product, including any investment advisory, wealth planning or trust arrangement managed or advised by AlTi or any AlTi Affiliate RIA, nor does it constitute investment, legal, or tax advice with respect to the products and services and it is important that you do not rely on its content when making an investment decision. Neither AlTi nor any AlTi Affiliate RIA make any representations through this information as to whether any security or other financial product is suitable to you or will be profitable. This information is not intended as a formal research report and should not be relied upon as a basis for making an investment decision. You should obtain relevant and specific professional advice before making any decision to enter into an investment transaction.

Investment in securities involves significant risk and has the potential for partial or complete loss of funds invested. Investments are not insured or guaranteed by the Federal Deposit Insurance Corporation (FDIC) or any other governmental agency. Prospectuses and offering documents should be read thoroughly before investing. No representation is made that any client will or is likely to achieve its objectives, that the strategies, investment process or risk management referenced in the information provided will be successful, or that any client will, or is likely to, make any profit, or will not suffer losses, including loss of principal. Past performance is no guarantee of future results.

Opinions regarding the suitability of investment approaches, including risk allocations and other portfolio decisions, are not tailored to any specific client, do not constitute recommendations, and are solely provided to facilitate discussion. Individual investor portfolios are constructed based on the individual’s financial resources, investment goals, risk tolerance, investment time horizon, tax situation and other relevant factors.

Any statements, assertions or the like (collectively, “Statements”) regarding prior or future market or other events, or views about investing, are based upon AlTi’s beliefs, which may not reflect those of the firm as a whole, unless the information provided includes the source(s) with respect to such Statements. Additionally, AlTi Affiliate RIAs may pursue investment strategies for clients that do not reflect or contradict the beliefs set forth in any Statement at any time, including at the time of publication. The Statements involve inherent risks and uncertainties, both general and specific, many of which cannot be predicted or quantified and are beyond the control of AlTi. Future evidence and actual results could differ materially from those set forth in, contemplated by, or underlying these Statements, which reflect AlTi’s beliefs at the time of publication and are subject to change. In light of these risks and uncertainties, there can be no assurance that these statements will prove to be accurate in any way.

Information given herein is believed to be reliable, but AlTi does not warrant to its completeness or accuracy, nor does AlTi assume any obligation to update or revise such information. Certain information has been provided by and/or is based on third-party sources and, although believed to be reliable, has not been independently verified and AlTi is not responsible for third-party errors.

Indices and Definitions

The 10-YEAR TREASURY YIELD INDEX measures the return on investment, expressed as a percentage, on a debt obligation (note) issued by the United States government with a maturity of 10 years upon initial issuance.

The 5-YEAR TREASURY YIELD INDEX measures the return on investment, expressed as a percentage, on a debt obligation (note) issued by the United States government with a maturity of 5 years upon initial issuance.

ASSET ALLOCATIONS: Tiedemann will change asset allocations over time and from time to time. Changes to the asset allocations may cause the Targeted Asset Class Returns to change, perhaps materially.

ALERIAN MLP TR U.S.D INDEX measures the performance of energy segment U.S. equity securities. It is a composite of the most prominent energy Master Limited Partnerships (‘MLPs’). The index is calculated using a float-adjusted, capitalization-weighted methodology.

BLOOMBERG MUNI INTER-SHORT 1-10 TR INDEX measures the performance of tax-exempt municipal bonds with more than one year and less than ten years remaining until maturity.

BLOOMBERG AGGREGATE BOND INDEX is an unmanaged broad base index comprised of intermediate term, investment grade bonds including Treasury bills, Government agency bonds, mortgage-backed bonds, Corporate bonds, and foreign bonds. The index is considered representative of the fixed income market as a whole.

BARCLAYS U.S. TIPS is an unmanaged index comprised of U.S. Treasury Inflation Protected Securities with one or more years remaining maturity with total outstanding issue size of $500mm or more and measures the performance of U.S. TIPS market.

BARCLAYS MUNI 1-YR is an unmanaged index comprised of investment grade, tax-exempt Municipal bond issues with maturities of one to two years, and is considered representative of the short-term Municipal bond market.

BARCLAYS MUNI 5-YR is an unmanaged index comprised of 4–6-year duration, fixed-rate, intermediate-duration, tax-exempt bonds representative of the municipal bond market of intermediate duration.

BLOOMBERG HIGH YIELD MUNICIPAL BOND INDEX is an unmanaged index composed of non-investment-grade, unrated, or rated below Ba1 bonds.

BLOOMBERG U.S. CORPORATE HIGH YIELD BOND INDEX measures the U.S.D-denominated, high yield, fixed-rate corporate bond market. Securities are classified as high yield if the middle rating of Moody’s, Fitch and S&P is Ba1/BB+/BB+ or below. Bonds from issuers with an emerging markets country or risk, based on the indices’ EM country definition, are excluded. The U.S. Corporate High Yield Index is a component of the U.S. Universal and Global High Yield Indices.

CRSP U.S. MEGA CAP GROWTH INDEX classifies growth securities using the following factors: future long-term growth in earnings per share (EPS), future short-term growth in EPS, 3-year historical growth in EPS, 3-year historical growth in sales per share, current investment-to-assets ratio, and return on assets.

DEBT TO EQUITY RATIO: a company's total long-term debt divided by total shareholders' equity. The result is a measure of a company's leverage.

ETF: An exchange traded fund (ETF) is a type of security that involves a collection of securities—such as stocks—that often tracks an underlying index, although they can invest in any number of industry sectors or use various strategies. ETFs are in many ways similar to mutual funds; however, they are listed on exchanges and ETF shares trade throughout the day just like ordinary stock.

EPS: Earnings per share (EPS) is calculated as a company's profit divided by the outstanding shares of its common stock. The resulting number serves as an indicator of a company's profitability.

FORWARD PRICE TO EARNINGS: The forward price to earnings (P/E) is the measure of a company's P/E ratio using its expected earnings, used by investors and analysts to determine the relative value of a market or company's shares against another or itself over time.

FTSE TREASURY BENCHMARK 10-YEAR is a market value-weighted index of public obligations of the U.S. Treasuries with maturities of ten years. The Index reflects no deduction for fees, expenses or taxes.

FTSE WORLD GOVERNMENT BOND INDEX (WGBI) measures the performance of fixed-rate, local currency, investment-grade sovereign bonds. The WGBI is a widely used benchmark that currently includes sovereign debt from over 20 countries, denominated in a variety of currencies, and has more than 30 years of history available. The WGBI provides a broad benchmark for the global sovereign fixed income market. Sub-indexes are available in any combination of currency, maturity, or rating.

HFRX ABSOLUTE RETURN INDEX is designed to be representative of the overall composition of the hedge fund universe. It is comprised of all eligible hedge fund strategies; including but not limited to convertible arbitrage, distressed securities, equity hedge, equity market neutral, event driven, macro, merger arbitrage, and relative value arbitrage.

JPMORGAN GBI EM INDEX is an index comprised of emerging market government debt denominated in local currencies.

*KBW Bank Index: This is a modified cap-weighted index consisting of 24 exchange-listed National Market System stocks, representing national money center banks and leading regional institutions.

MERRILL LYNCH HIGH YIELD MASTER II INDEX is an unmanaged index that tracks the performance of below investment grade U.S. dollar-denominated corporate bonds publicly issued in the U.S. domestic market.

A mortgage-backed security (MBS) is an investment similar to a bond that is made up of a bundle of home loans bought from the banks that issued them.

MSCI ACWI INDEX captures large and mid cap representation across 23 Developed Markets and 27 Emerging Markets countries.

MSCI CHINA INDEX is constructed based on the integrated China equity universe included in the MSCI Emerging Markets Index, providing a standardized definition of the China equity opportunity set. It captures large- and mid-cap representation across China A shares, H shares, B shares, Red chips, P chips and foreign listings (e.g., ADRs). With 704 constituents, the index covers about 85% of this China equity universe. Currently, the index includes Large Cap A and Mid Cap A shares represented at 20% of their free float adjusted market capitalization. China A shares will be partially included in this index, making it the de facto index for all of China.

MSCI EAFE is a free float-adjusted market capitalization index that is designed to measure the equity market performance of developed markets, excluding the U.S. & Canada.

MSCI EM is a free float-adjusted market capitalization weighted index that is designed to measure the equity market performance of emerging markets.

MSCI U.S. REIT Index is a free float-adjusted market capitalization weighted index that is comprised of equity Real Estate Investment Trusts (REITs)

OPERATING MARGIN measures how much profit a company makes on a dollar of sales, after paying for variable costs of production, such as wages and raw materials, but before paying interest or tax. It is calculated by dividing a company’s operating profit by its net sales.

RU.S.SELL 1000 measures the performance of the large-cap segment of the U.S. equity universe. It includes approximately 1,000 of the largest securities based on a combination of their market cap and current index membership of the Russell 3000.

RU.S.SELL 2000 is a market cap-weighted index that measures the performance of the small-cap segment of the U.S. equity universe. It includes approximately 2000, or 10% in total market-capitalization, of the smallest securities of the Russell 3000 based on a combination of market cap and current index membership.

S&P 500 INDEX consists of approximately 500 stocks chosen for market size, liquidity, and industry grouping, among other factors. The S&P 500 is designed to be a leading indicator of U.S. equities and is meant to reflect the risk/return characteristics of the large-cap universe.

SPDR Barclays Capital High Yield Bond ETF is designed to measure the performance of publicly issued U.S. dollar denominated high yield corporate bonds with above-average liquidity.

US Consumer Price Index Shelter: The index for the service that a housing unit provides its occupants. Owners’ equivalent rent of residences and rent of primary residence measure the majority of the change in the shelter cost consumers experience.

Zillow Observed Rent Index (ZORI): A smoothed measure of the typical observed market rate rent across a given region. The index is dollar-denominated by computing the mean of listed rents that fall into the 40th to 60th percentile range for all homes and apartments in a given region, which is once again weighted to reflect the rental housing stock.

Start the conversation

Get in touch to find out what our global team can do for you.

Let's talk